Hi Guys, Today I'll Show you how to save the Console Log into a specific Directory and How to do the Diagnostic logging in ADF 12C.
While running your Fusion Application, the console output of the embedded Weblogic server is displayed in the log Pane of JDeveloper


While running your Fusion Application, the console output of the embedded Weblogic server is displayed in the log Pane of JDeveloper

You can also save the console log into a particular directory go to -->Tools -->Preferences --> log then specify the directory and Maximum Log Lines and once you will run the application,you will find the log file in that particular directory.

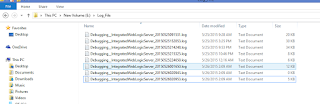
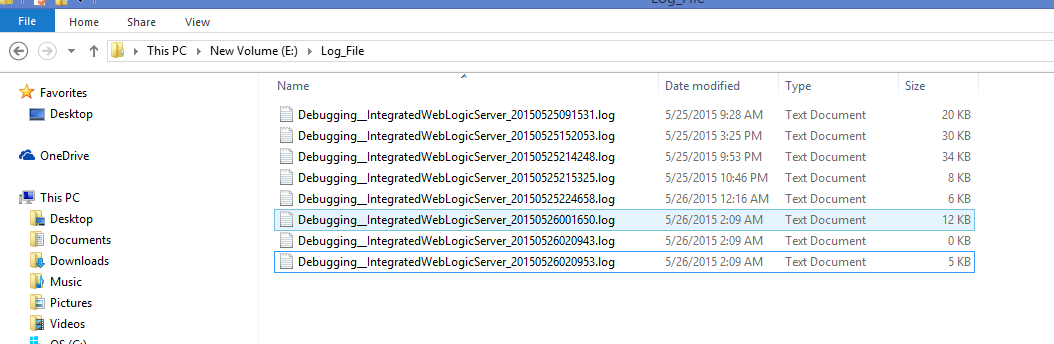
Now you see the log file Also in E:\Log_File Directory.
Now I'll Show you, How to diagnostic logging.
ADF Diagnostic Logging is good feature in J Developer by which we can fine tune the log generation of our Apps.
ADF diagnostics logging is controlled via the usage of the jbo.debugoutput parameter. Using this parameter with the console value, i.e. -Djbo.debugoutput=console, produces diagnostic logs directly in the J Developer Log window. When set to the ADF Logger value, diagnostics are routed through the standard J2SE Logging API and is controlled through the logging.xml configuration file. For the integrated Web Logic server this file can be found the C:\Users\USER\AppData\Roaming\JDeveloper\system12.1.3.0.41.140521.1008\DefaultDomain\config\fmwconfig\servers\DefaultServer for Windows 7
In the Application Server Navigator – use View | Application Server Navigator to display if needed – expand the Application Servers node and right-click on the IntegratedWebLogicServer and From the context menu select Configure Oracle Diagnostic Logging for “IntegratedWebLogicServer”.

Now Open the logging.xml In the Loggers section expand the Root Logger (default) node to display all the loggers that are declared.

The three columns in the Overview tab display the Name of the logger, the diagnostics logging Level for the logger and any log handlers associated with the logger. The Name of the logger represents the Java package that will be generating the specific diagnostics logs. The Level value specifies the granularity of the diagnostic logs to be generated and it is defined either in terms of the ODL (Oracle Diagnostics Logging) Log Levels below.

And java log level is below -
You can control the Log Level type (ODL or Java) through the drop down on the top right just above the Declares Handles column.
The Declares Handles column associates one or more log handlers to the specific logger. To illustrate, select a logger that has an associated log handler - an icon in the Declares Handles column - and expand the Handler Declarations section to display the associated log handlers.
The Declares Handles column associates one or more log handlers to the specific logger. To illustrate, select a logger that has an associated log handler - an icon in the Declares Handles column - and expand the Handler Declarations section to display the associated log handlers.
OK. Let's generate some diagnostics now. Select the oracle.jbo logger in the Loggers tree and set its Level to FINEST – you may need to switch the log type to Java Log Types. This will override the default setting of the Root Logger in order to log all diagnostics generated by the oracle.jbo classes. There is no need to declare a specific handler, the one(s) defined for the Root Logger will be used as long as we ensure that the Use Parent Handlers check box remains selected. Make sure that you save the logging.xml file.
Before running your application open the ViewController Project Properties dialog, select the Run/Debug/Profile page and Edit… the Run Configuration. In the Edit Default Configuration dialog Launch Settings enter -Djbo.debugoutput=adflogger -Djbo.adflogger.level=FINEST in the Java Options.

Save the Project Properties and run your application. Observe the oracle.jbo diagnostic logs generated in the Log window. The same log entries are written in the C:\Users\USER\AppData\Roaming\JDeveloper\system12.1.3.0.41.140521.1008\DefaultDomain\servers\DefaultServer\logs\DefaultServer-diagnostic.log file as well.
Now you can set log level as per your requirement and analyse the log.
Thanks Guys.


No comments:
Post a Comment