Hi Guys, Today I'll share hoe to use bar and pie chart in Oracle JET.
I have created project using CLI,change the code in incidents.js and incidents.html file.
To implement the same follow the below steps-
S1- Create project and run.


S2- Now change the code we have to remember 3 points-
I have created project using CLI,change the code in incidents.js and incidents.html file.
To implement the same follow the below steps-
S1- Create project and run.
Once run the project we can see the default implementation in browser click on Incidents tab and see the below page.

S2- Now change the code we have to remember 3 points-
- Change the define method inside incidents.js file.
- add the static data in js file and invoke observableArray method from knockout.
- add the code inside incidents.html file.
Copy and paste the below code in incidents.js and incidents.html file.
incidents.js file -
/**
* @license
* Copyright (c) 2014, 2018, Oracle and/or its affiliates.
* The Universal Permissive License (UPL), Version 1.0
*/
/*
* Your incidents ViewModel code goes here
*/
define(['ojs/ojcore', 'knockout', 'jquery', 'ojs/ojchart'],
function(oj, ko, $) {
function IncidentsViewModel() {
var self = this;
/*
* Jet Component Example
*/
var data =[{name:"Pedestrians", items: [42]},
{name:"Vehicles", items: [55]},
{name:"Bicycles", items: [36]},
{name:"Buses", items: [22]},
{name:"Trains", items: [22]},
{name:"Bullcart", items: [11]},
{name:"Horsecart", items: [15]}];
self.datasource = ko.observableArray(data);
// Below are a set of the ViewModel methods invoked by the oj-module component.
// Please reference the oj-module jsDoc for additional information.
/**
* Optional ViewModel method invoked after the View is inserted into the
* document DOM. The application can put logic that requires the DOM being
* attached here.
* This method might be called multiple times - after the View is created
* and inserted into the DOM and after the View is reconnected
* after being disconnected.
*/
self.connected = function() {
// Implement if needed
};
/**
* Optional ViewModel method invoked after the View is disconnected from the DOM.
*/
self.disconnected = function() {
// Implement if needed
};
/**
* Optional ViewModel method invoked after transition to the new View is complete.
* That includes any possible animation between the old and the new View.
*/
self.transitionCompleted = function() {
// Implement if needed
};
}
/*
* Returns a constructor for the ViewModel so that the ViewModel is constructed
* each time the view is displayed. Return an instance of the ViewModel if
* only one instance of the ViewModel is needed.
*/
return new IncidentsViewModel();
}
);
incidents.html file -
<!--
Copyright (c) 2014, 2018, Oracle and/or its affiliates.
The Universal Permissive License (UPL), Version 1.0
-->
<div class="oj-hybrid-padding">
<h1>Incidents Content Area</h1>
<oj-chart type="bar"
series="[[datasource]]">
</oj-chart>
<oj-chart type="pie"
series="[[datasource]]">
</oj-chart>
<div>
To change the content of this section, you will make edits to the incidents.html file located in the /js/views folder.
</div>
</div>
Now save the file and see the browser, page will display the bar and pie chart -
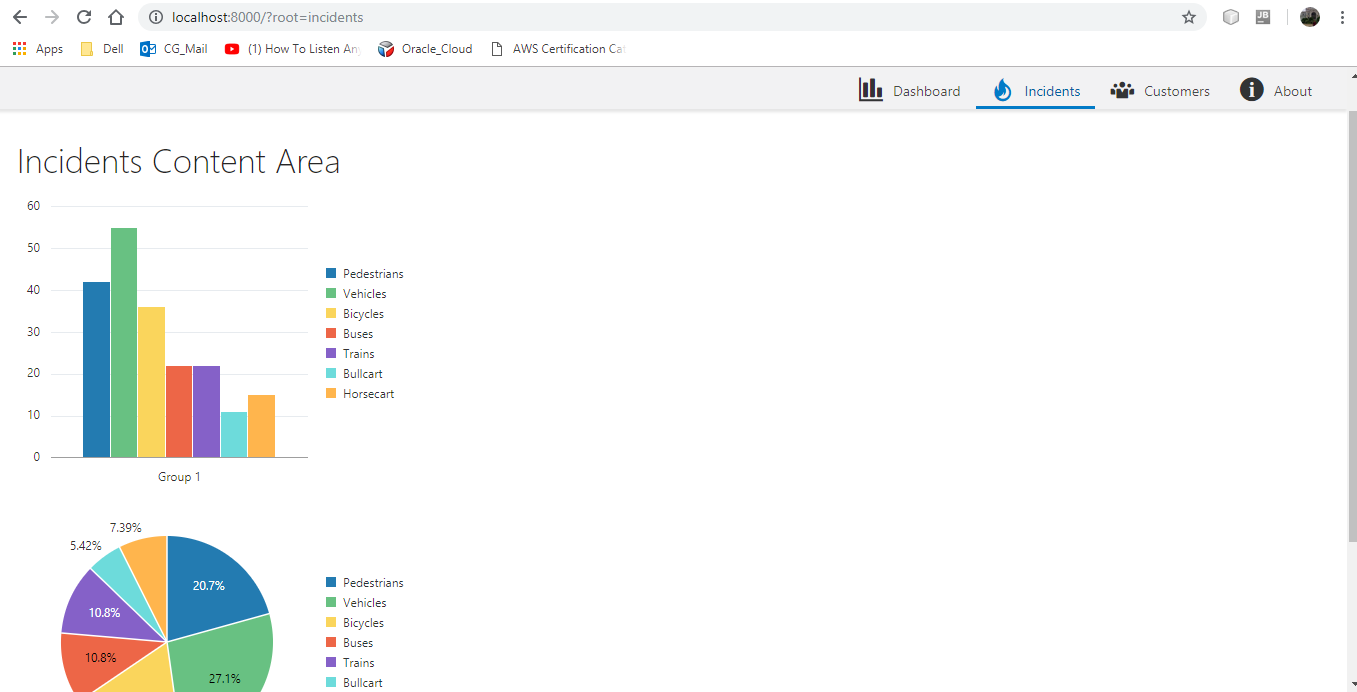
Cheers Guys:)


No comments:
Post a Comment